What the trade will cost you,
the one you have not opened yet

The terminal measures, from the coin's own history, how your planned trade would end: where you get liquidated, how much you lose and how often that already happened. It suggests only schemes that passed a test on history they never saw, keeps your journal and shows where you lose money on your own.

270coins measured
10exchanges to choose from
90days of history in every measurement
9 096service checks per run
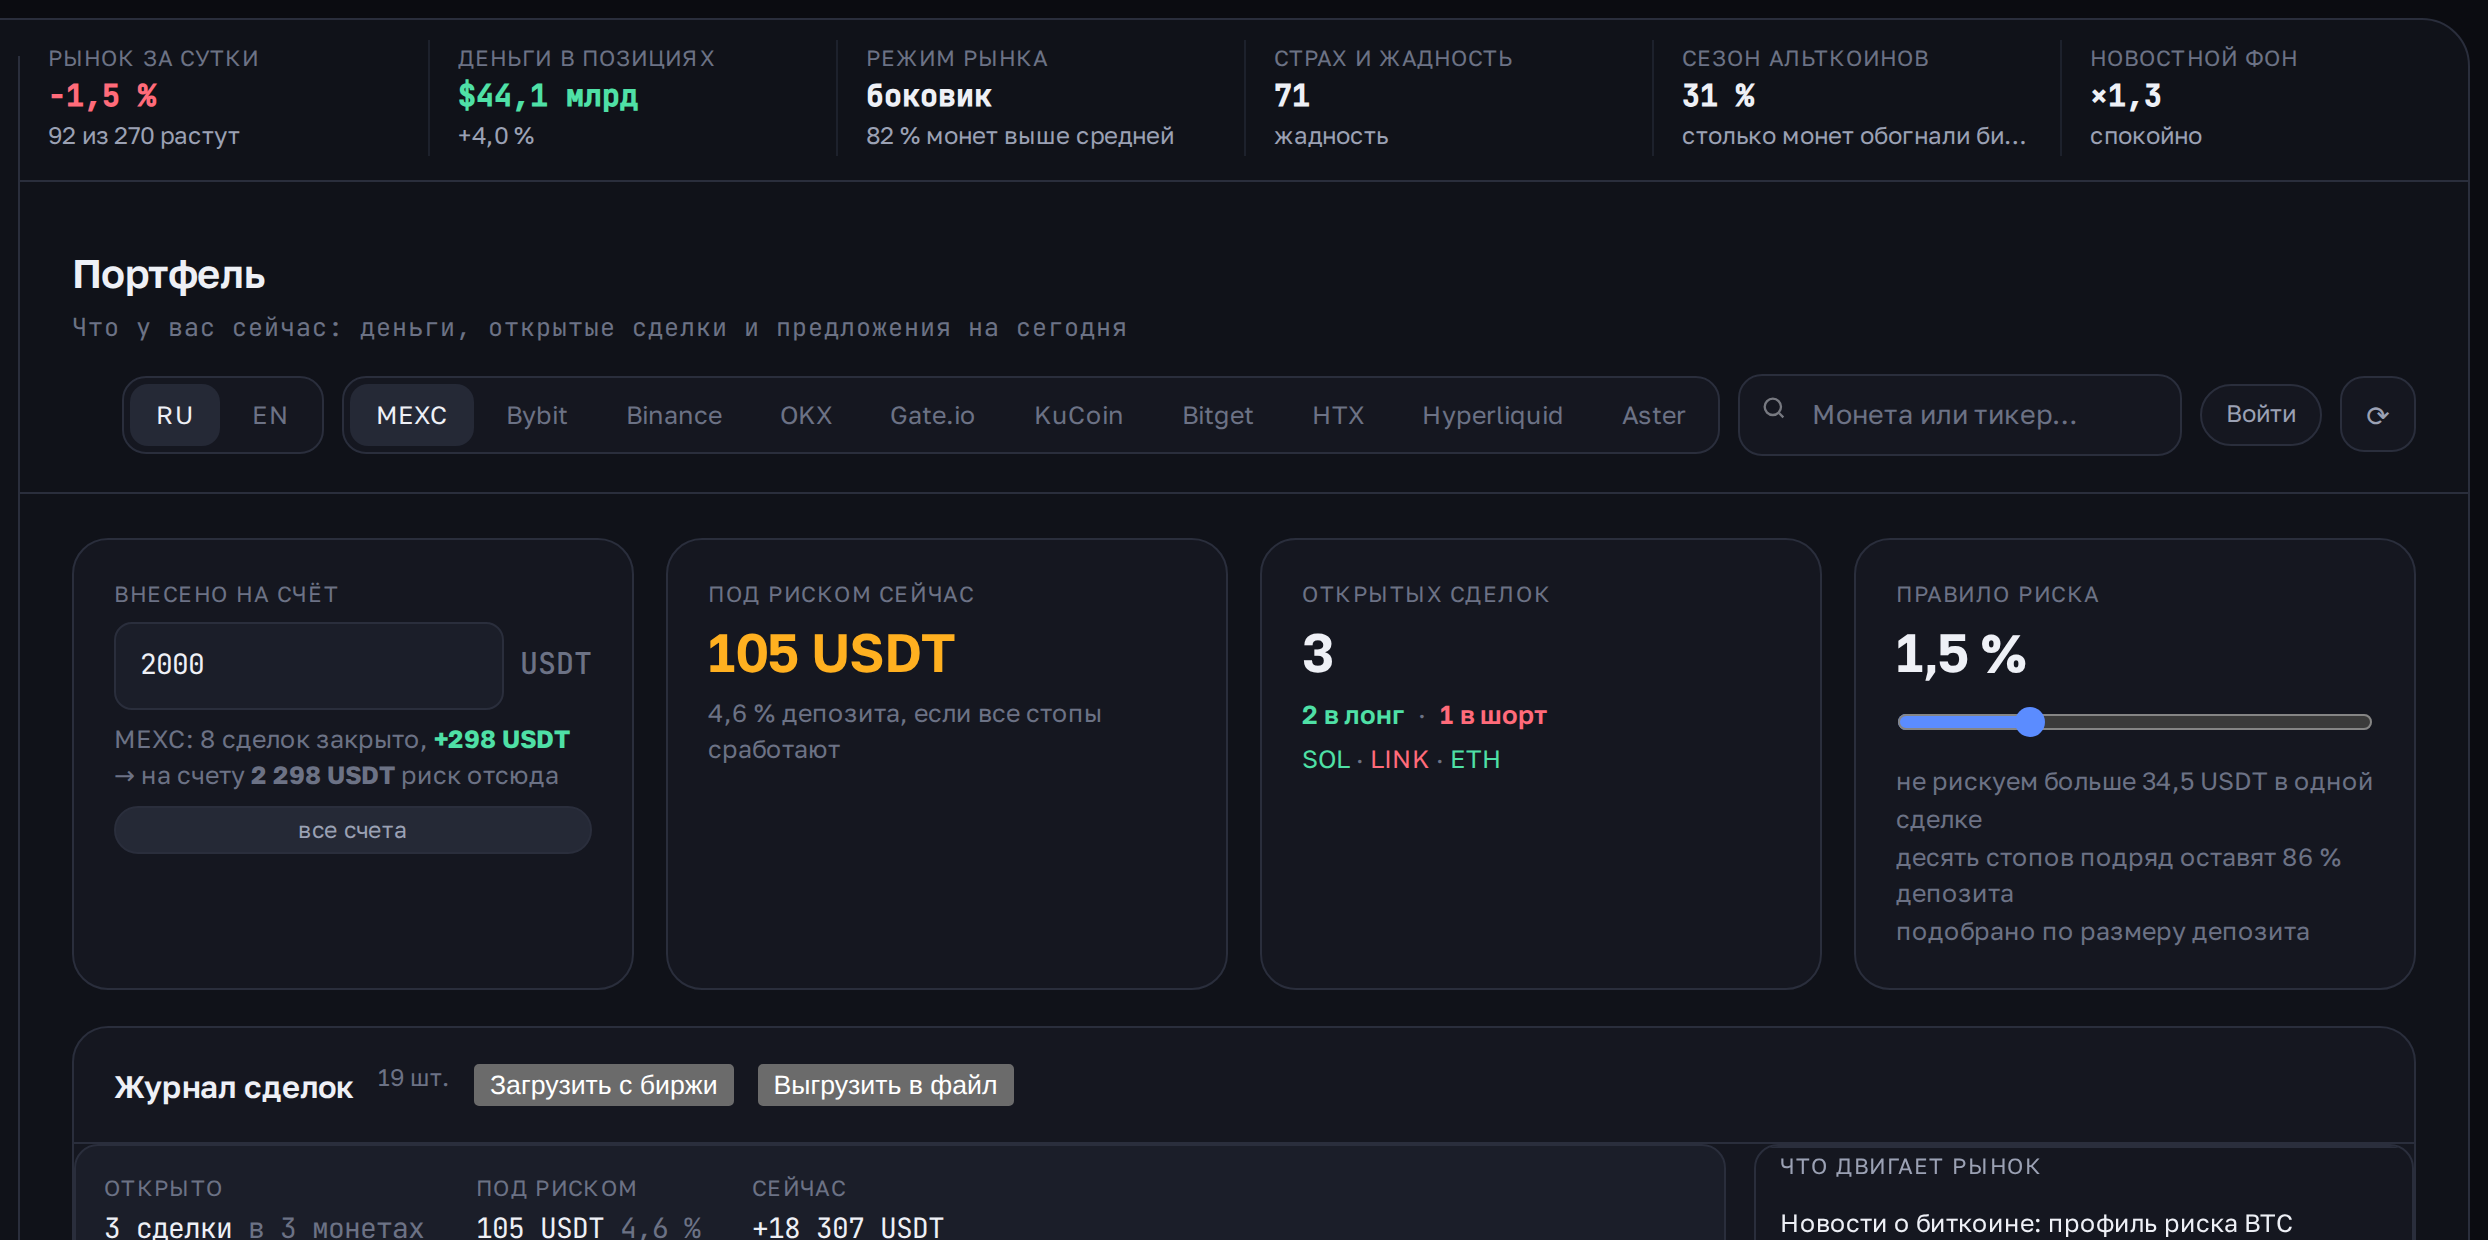
Portfolio: how much is at risk, open trades by side, the journal and today's candidates
Everything in one place · 10 tools
◎Entry and riskwhere it wipes you out and what it costs
◈Today's planschemes that passed the test
▤Trade journalimport by file or read-only key
⚑Disciplinewhat breaking rules costs
◷Cost of timewhat each day in a position costs
◍Longs and shortswhich side is bigger and how much money is behind it
◆Newsthe ones that move price, not everything
◉Tidewhere a coin is suddenly being talked about
≡Coin breakdownsa ready calculation for each
✉Alertsstop, deadline, turn, weekly summary
Measured on candles from ten exchanges
MEXCBybitBinanceOKXGate.ioKuCoinBitgetHTXHyperliquidAster
What is measured here

Four questions the service answers with a number

1 — Entry and risk

Where it wipes you out and what that costs

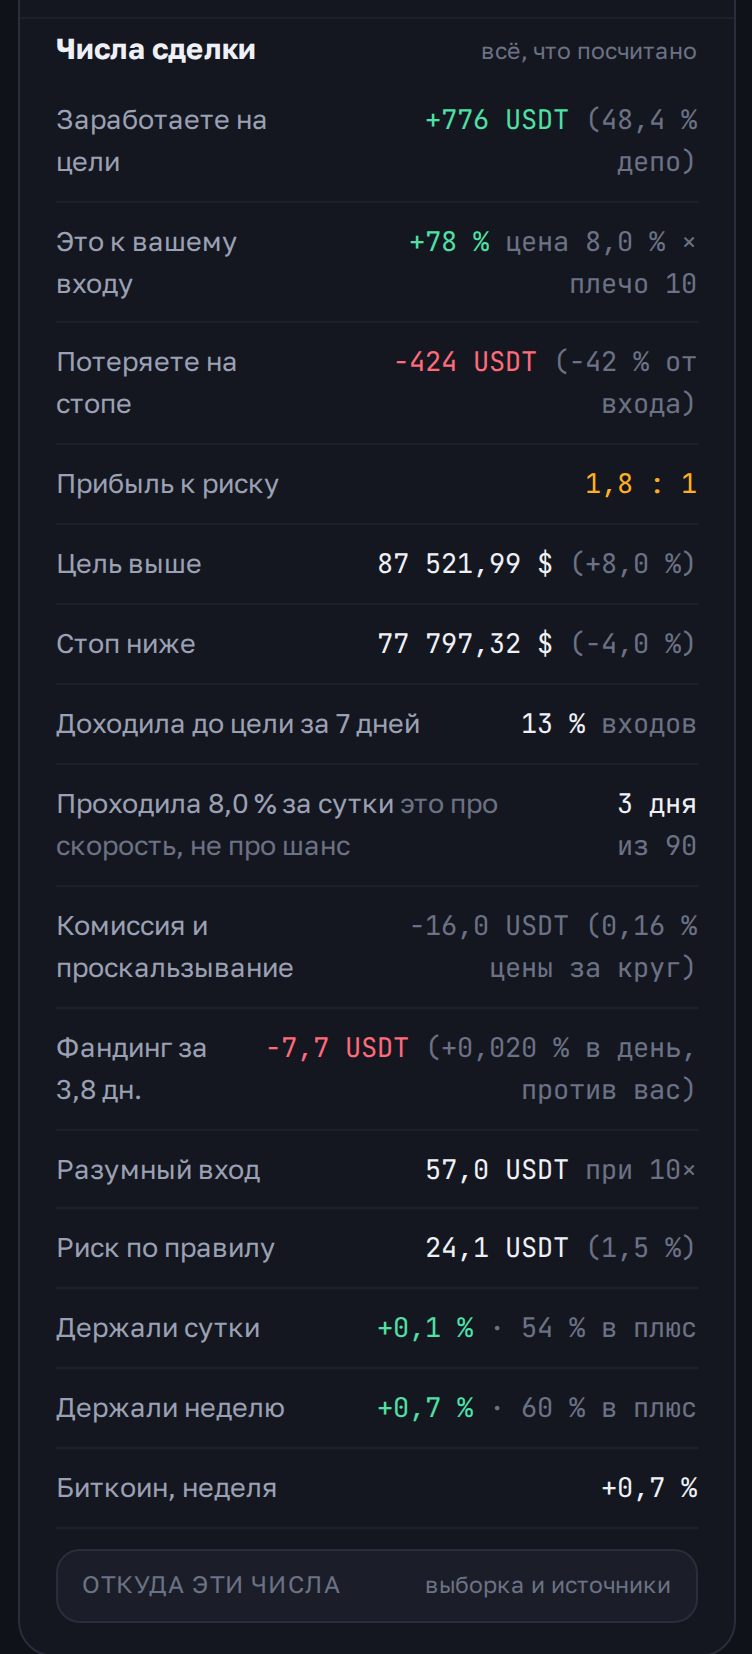
You name the coin, the size and the leverage — the service measures on ninety days of candles how it would end. Not roughly, but as a number: at what move liquidation hits and how many times the coin already covered that distance in a day.

  • Liquidation price at your leverage, fees included
  • How many times in 90 days price travelled that far
  • Stop and target in money, not percent
  • A plain no: “the payoff is weak, the profit does not pay for the risk”
See it on bitcoin →
Where it wipes you out and what that costs
2 — Reading the past

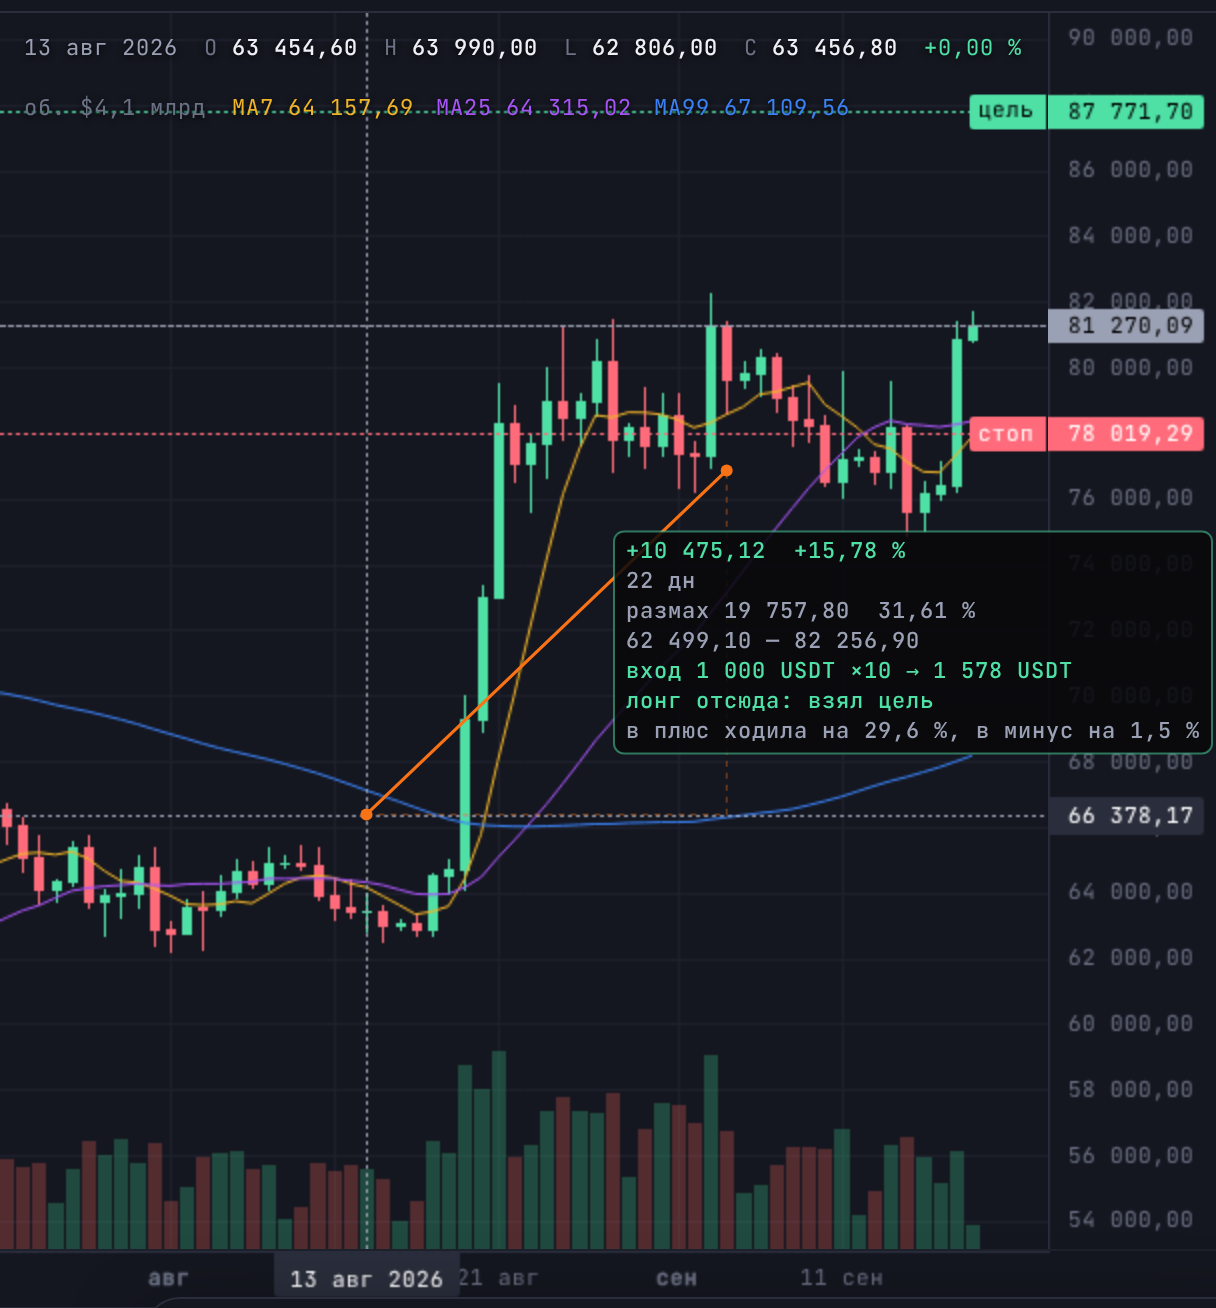
Select a stretch on the chart and see how it would have ended

This is the real answer to “what if”. Drag the mouse over any stretch of history and the service runs a trade with your stop and target across those candles: would it have hit the target, or would you have been stopped out first.

  • The move in percent and in money, at your size and leverage
  • “Long from here: target hit” or “stopped out” — from candles, not by eye
  • How far price ran in your favour and against: you see whether your stop is too tight
  • The range of the stretch and how many days it took
Try it on bitcoin →
Select a stretch on the chart and see how it would have ended
3 — Today's plan

Only what passed the test is shown

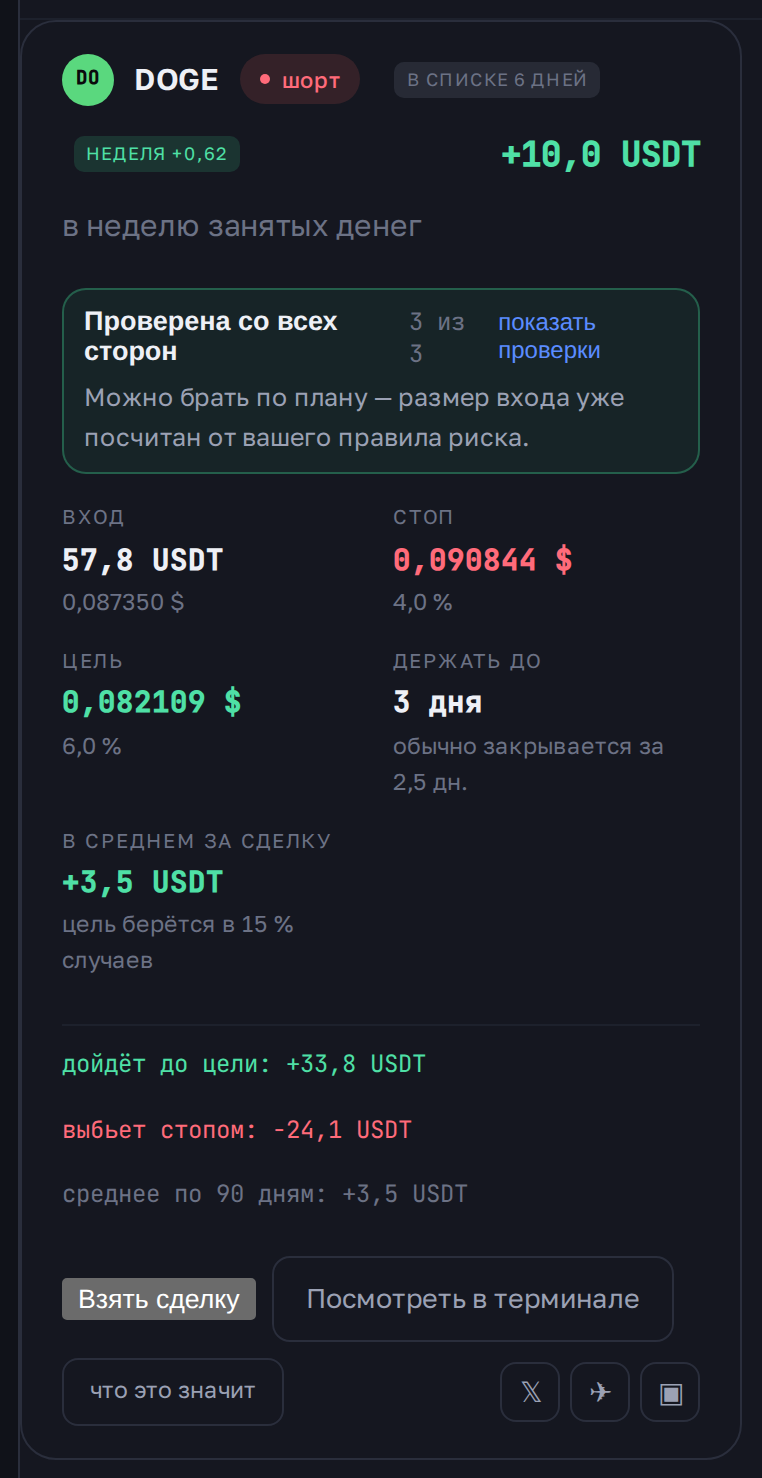
A scheme is fitted on two thirds of the history and tested on the last third, which the fitting never saw. Whatever fails that test is not shown at all — however good it looked while fitting.

  • Position size follows from your own risk rule
  • Ready levels: entry, stop, target, holding time
  • A mark if you already hold a position in that coin
  • One button: log the trade and open the exchange
Where these numbers come from →
Only what passed the test is shown
4 — Journal and discipline

It counts your habits, not just your profit

Trades come in as one export file from the exchange. After that the service shows what no broker report does: not how much you made, but what made it.

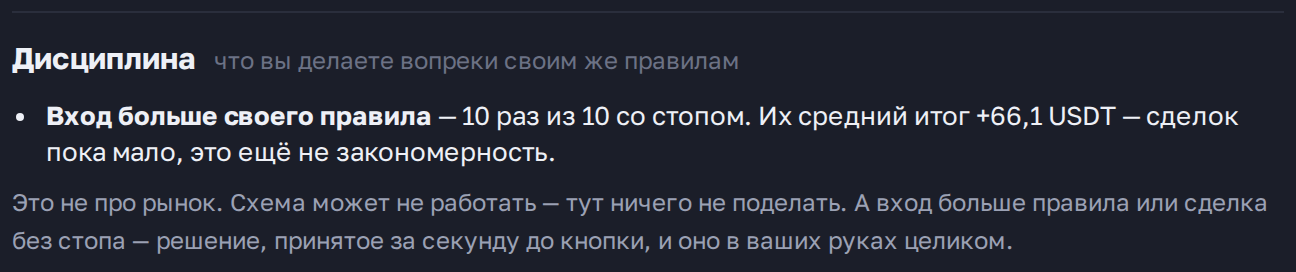
  • How often you entered above your own rule — and how that ended
  • How many times longer you hold losses than profits
  • Where risk piled up: half the deposit in one coin
  • Risk is counted on what is left in the account, not on a number typed long ago
How to read these numbers →
It counts your habits, not just your profit
5 — Market turn

You learn about the turn from us, not from your stop

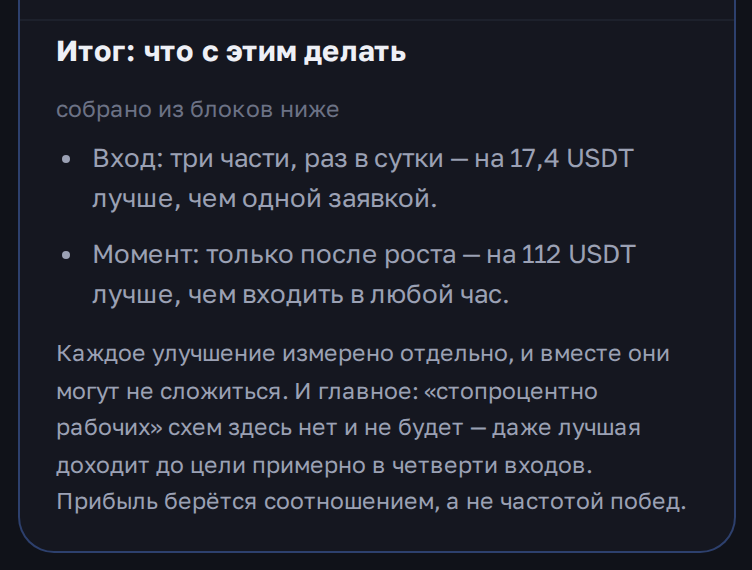
The same scheme is re-measured on the last week's entries. Ninety days describe the market's habit; a week shows whether the habit has changed. When the two answers disagree, the service says so plainly.

  • A “week −0.55” mark right in the suggestion row
  • A side that failed the quarter but works now — flagged as such
  • A Telegram warning for each open trade
  • Dropped suggestions are named, not silently removed
What data this is measured on →
You learn about the turn from us, not from your stop
6 — Cost of time

In crypto a position costs money every day

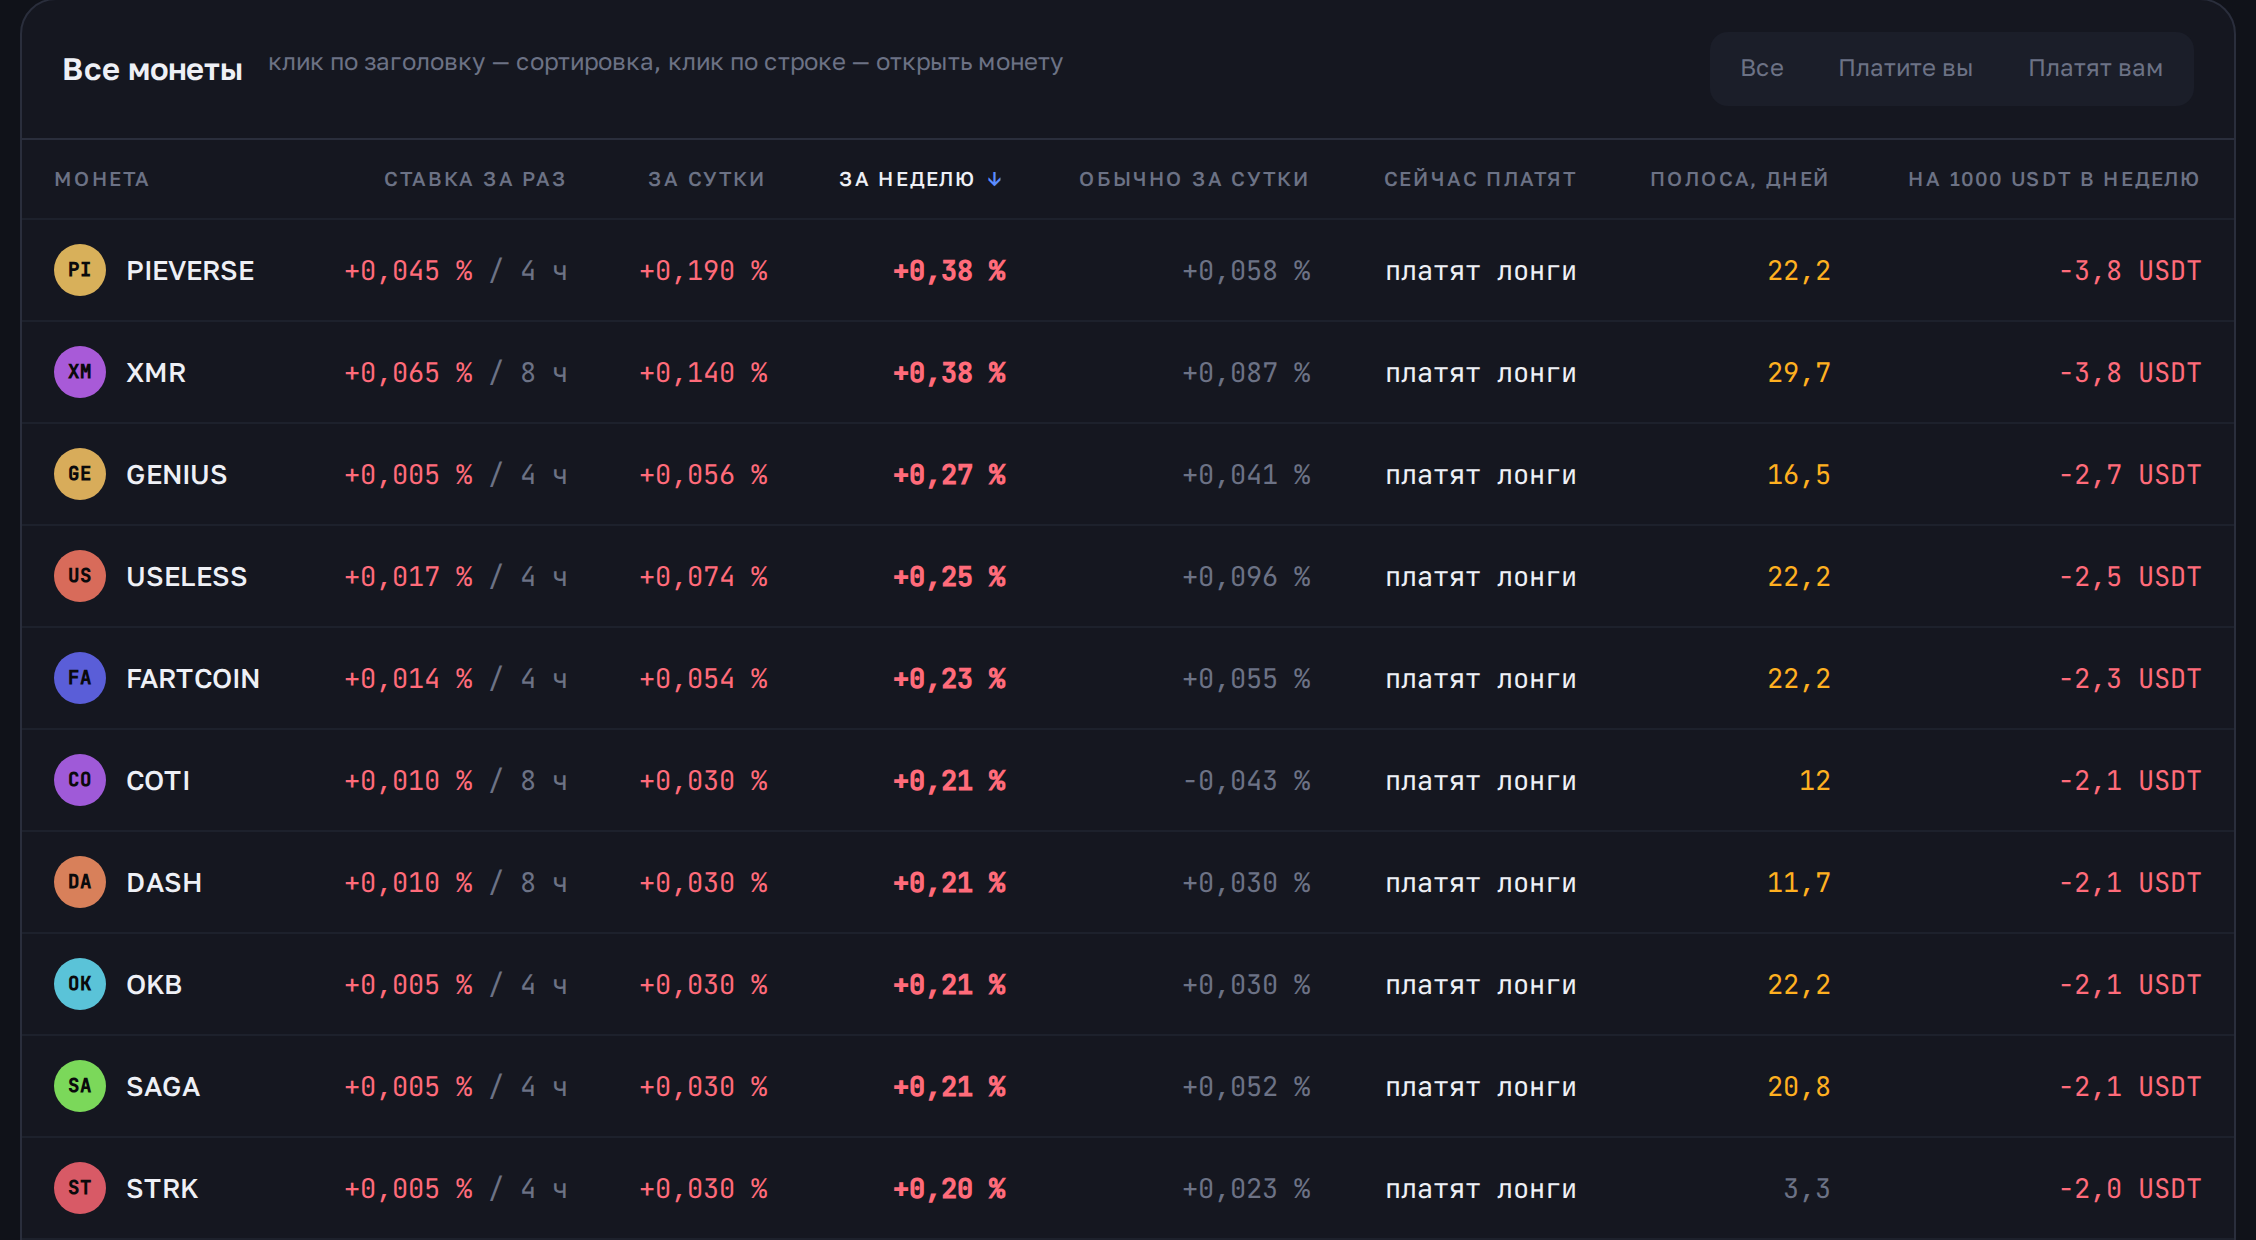
With leverage, funding is charged on an open position several times a day for as long as you hold it. You pay it not to the exchange but to the other side of the market, and on a skewed coin it adds up to more than a percent a week. People count risk by the stop and never notice this money: it leaves in small pieces.

  • The rate for each coin: per charge, per day and per week
  • What a week of holding costs on a 1000 USDT position
  • Where you pay and where you get paid
  • The charging interval: hourly, every four or every eight hours — it differs by coin
  • Where the same position is cheaper to hold: every exchange rate side by side
See it across the market →
In crypto a position costs money every day
7 — Longs and shorts

Which side is bigger on a coin and how much money is behind it

Open interest on its own means nothing — it is read together with price. Price up and more positions: new money is coming in. Price up but fewer positions: shorts are closing, and the rally ends with them.

  • Money in open positions per coin and how it moved in a day
  • What share of accounts is long and where the skew is strongest
  • The conclusion in words: new money, short squeeze, shorts building, longs leaving
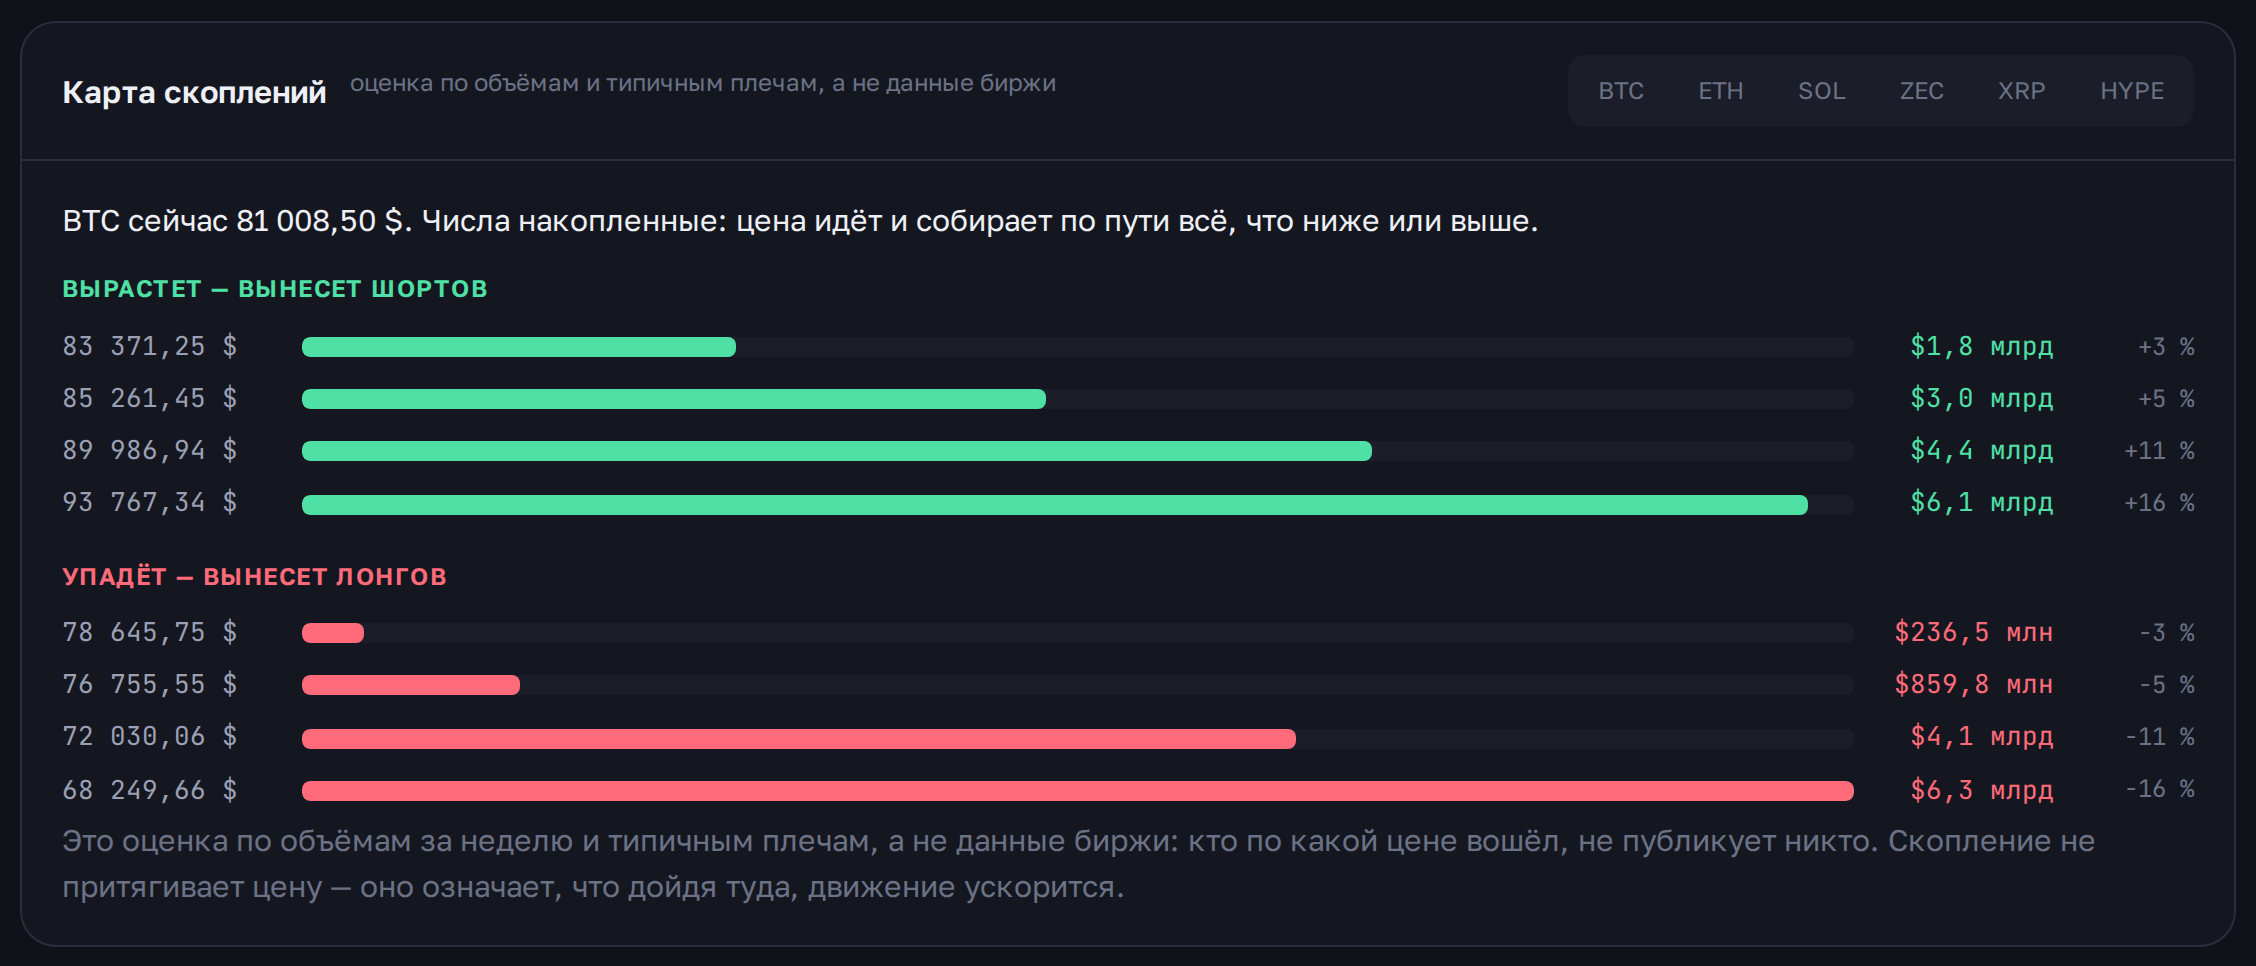
  • An estimate of clusters: where price would go and how much it wipes out on the way
Open the cluster map →
Which side is bigger on a coin and how much money is behind it
8 — Trading breakdown

What works for you and what you do to your own detriment

A separate section measures you, not the market. It needs about ten closed trades — after that it shows what no exchange report does.

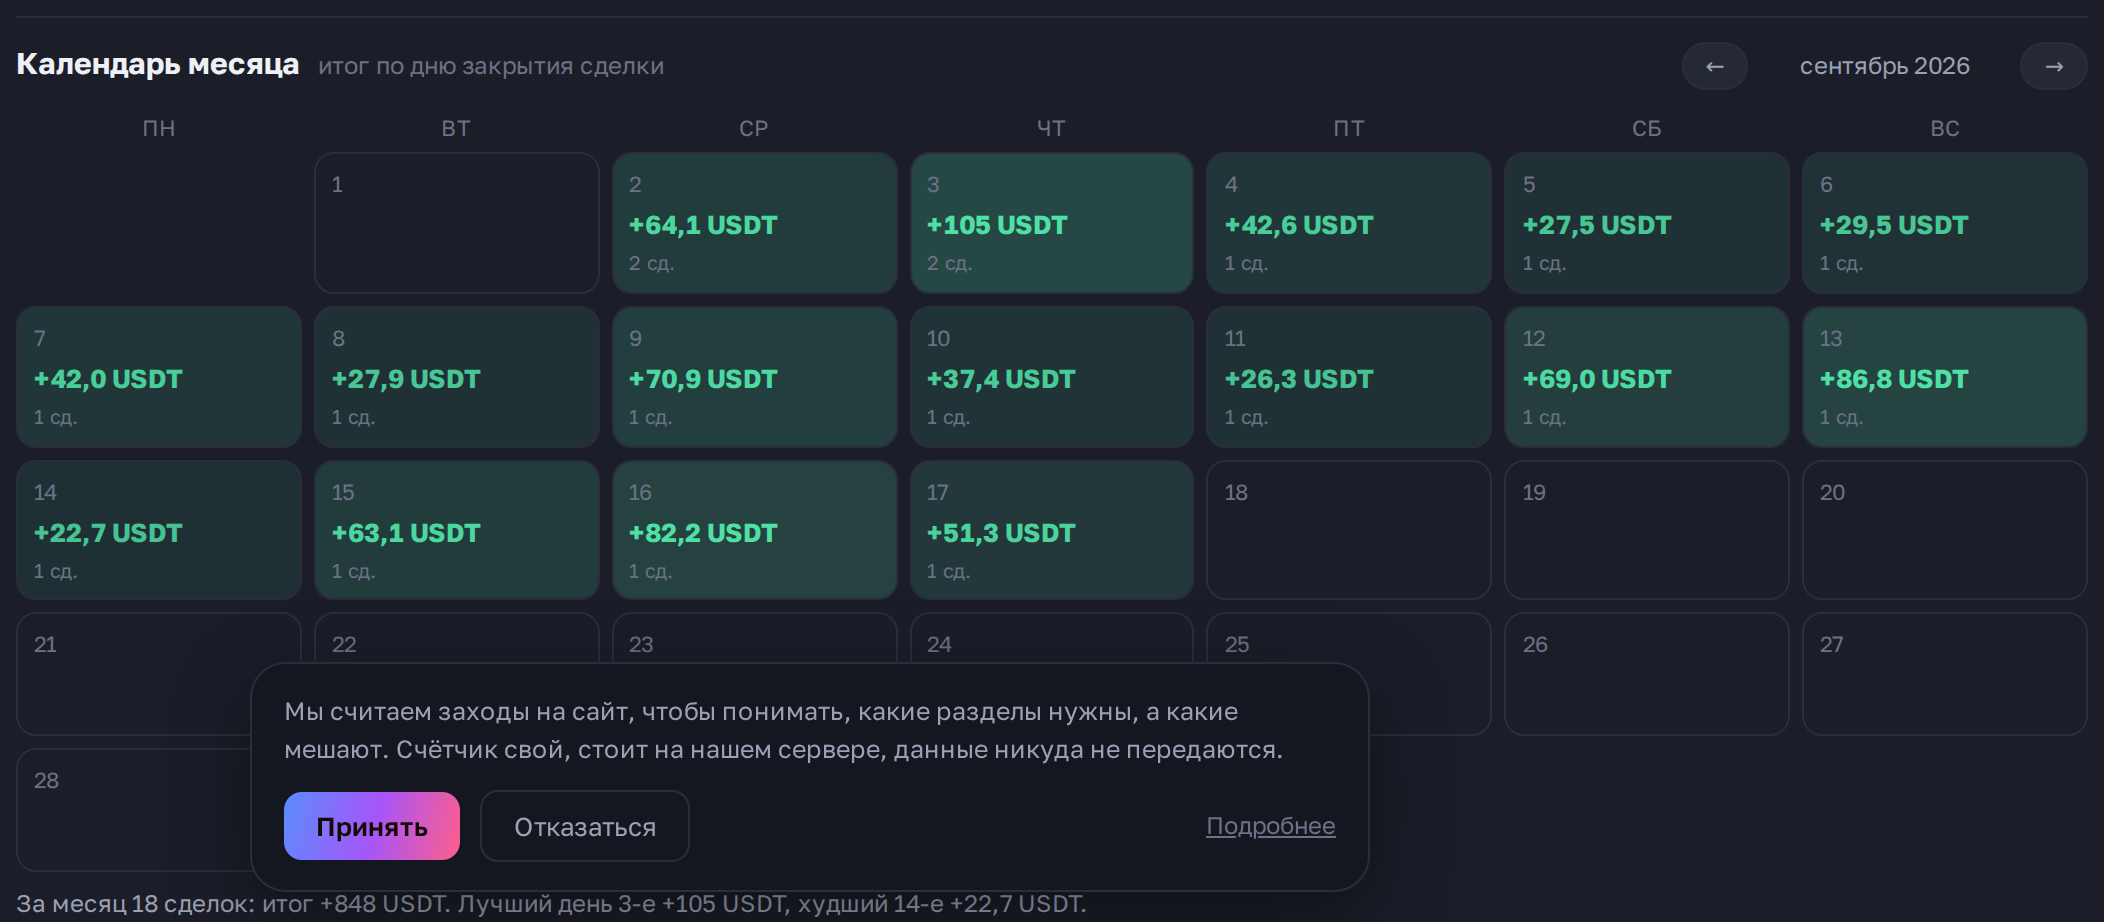
  • The month calendar: what each day brought
  • Which hours and coins you are up on, and which you are not
  • Whether you hold losses longer than profits, and how often you exceeded your rule
  • Trade replay on the chart: what was visible at the moment of entry
  • Your setups: which of your ways of trading feeds you and which eats you
See the breakdown →
What works for you and what you do to your own detriment
9 — Choosing a coin

Two coins side by side, by the same numbers

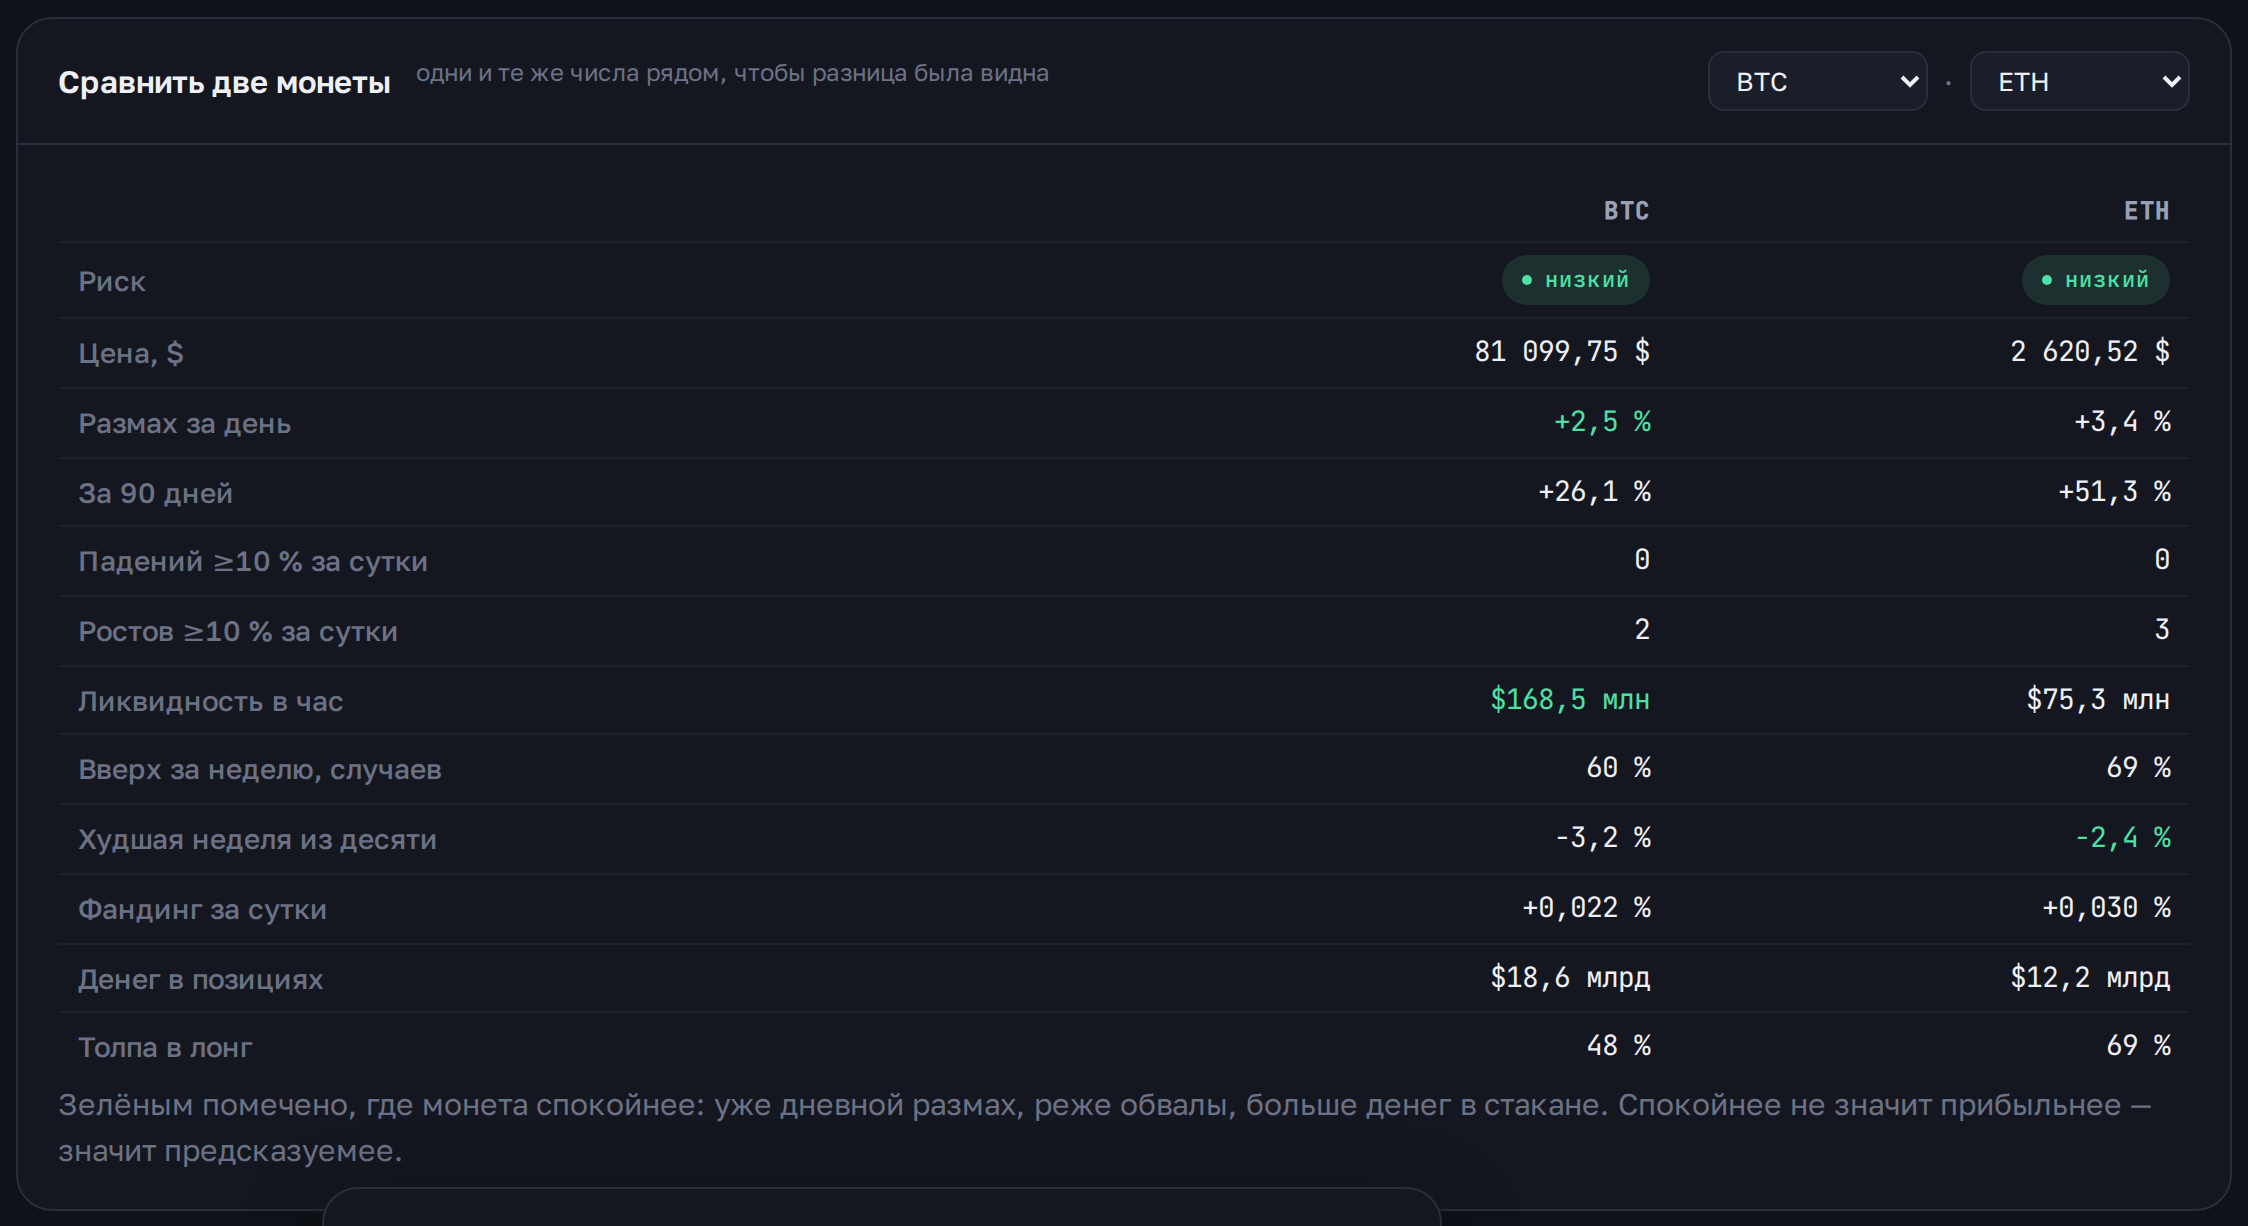
People usually choose not among a hundred coins but between the one they hold and the one they are watching. The service puts their numbers side by side and marks which coin is calmer.

  • Daily range, crashes, liquidity, odds of a weekly gain
  • The worst week in ten — how much was lost in the bad case
  • Cost of time and crowd skew for each of the two
  • Calmer does not mean more profitable — it says so on the screen
Compare coins →
Two coins side by side, by the same numbers
10 — Your setups

Which of your ways feeds you and which eats you

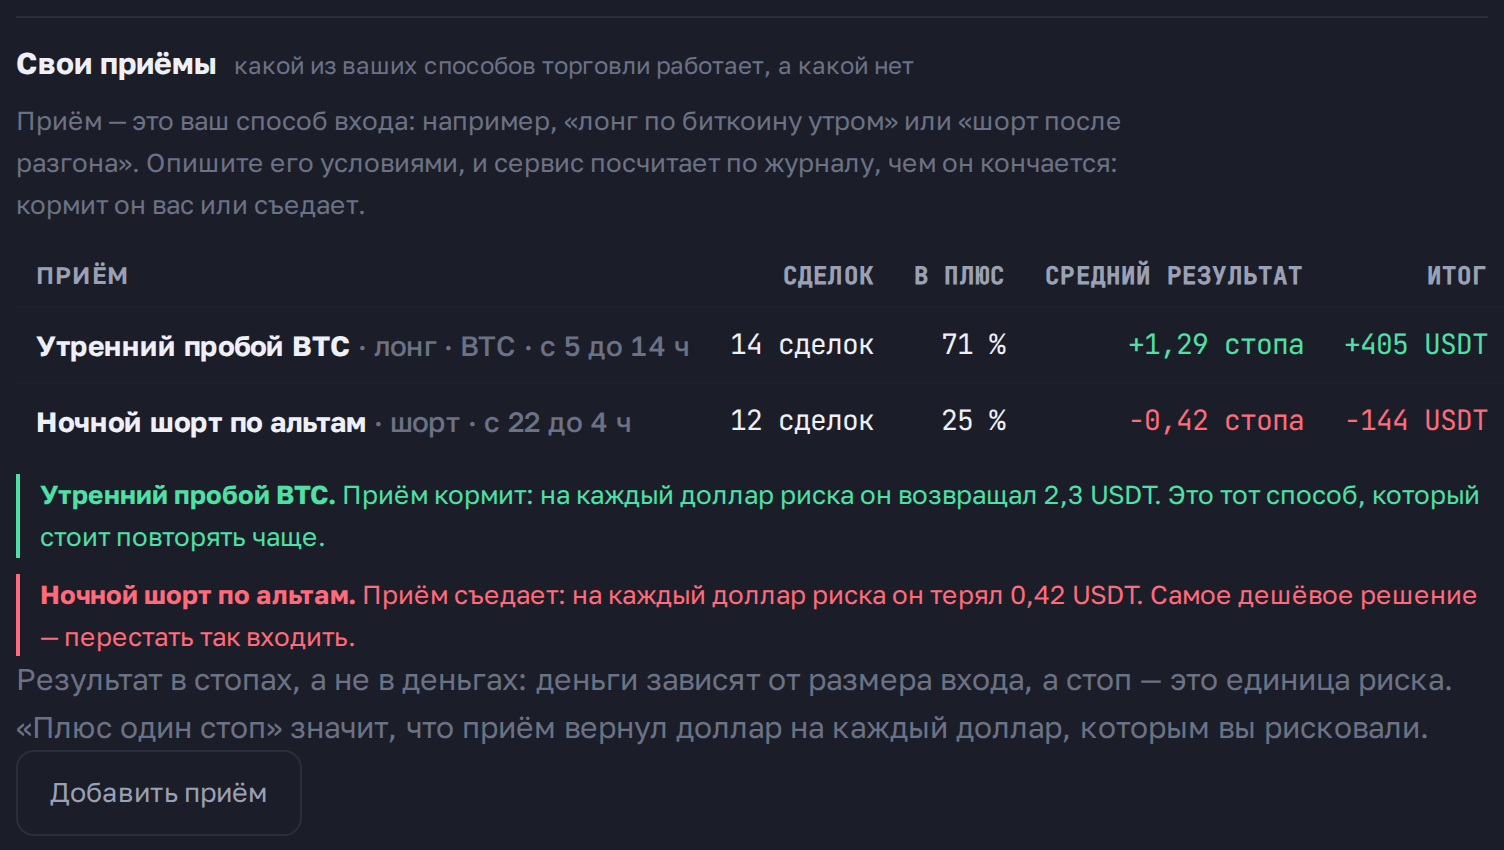
Nobody trades “in general”: you have two or three ways — a morning breakout, a pullback to the average, a short after a run-up. In one journal they blend into an average that means nothing. Describe a setup with conditions and the service finds its trades and measures them.

  • No manual tagging: the conditions are the tag
  • The result in stops: that is what the setup returned per dollar risked
  • A verdict in words — repeat it more often, or stop entering this way
  • Under ten trades the service says plainly that it is too early to judge
Describe your setup →
Which of your ways feeds you and which eats you
11 — Where it is cheaper to hold

The same position costs less on another exchange

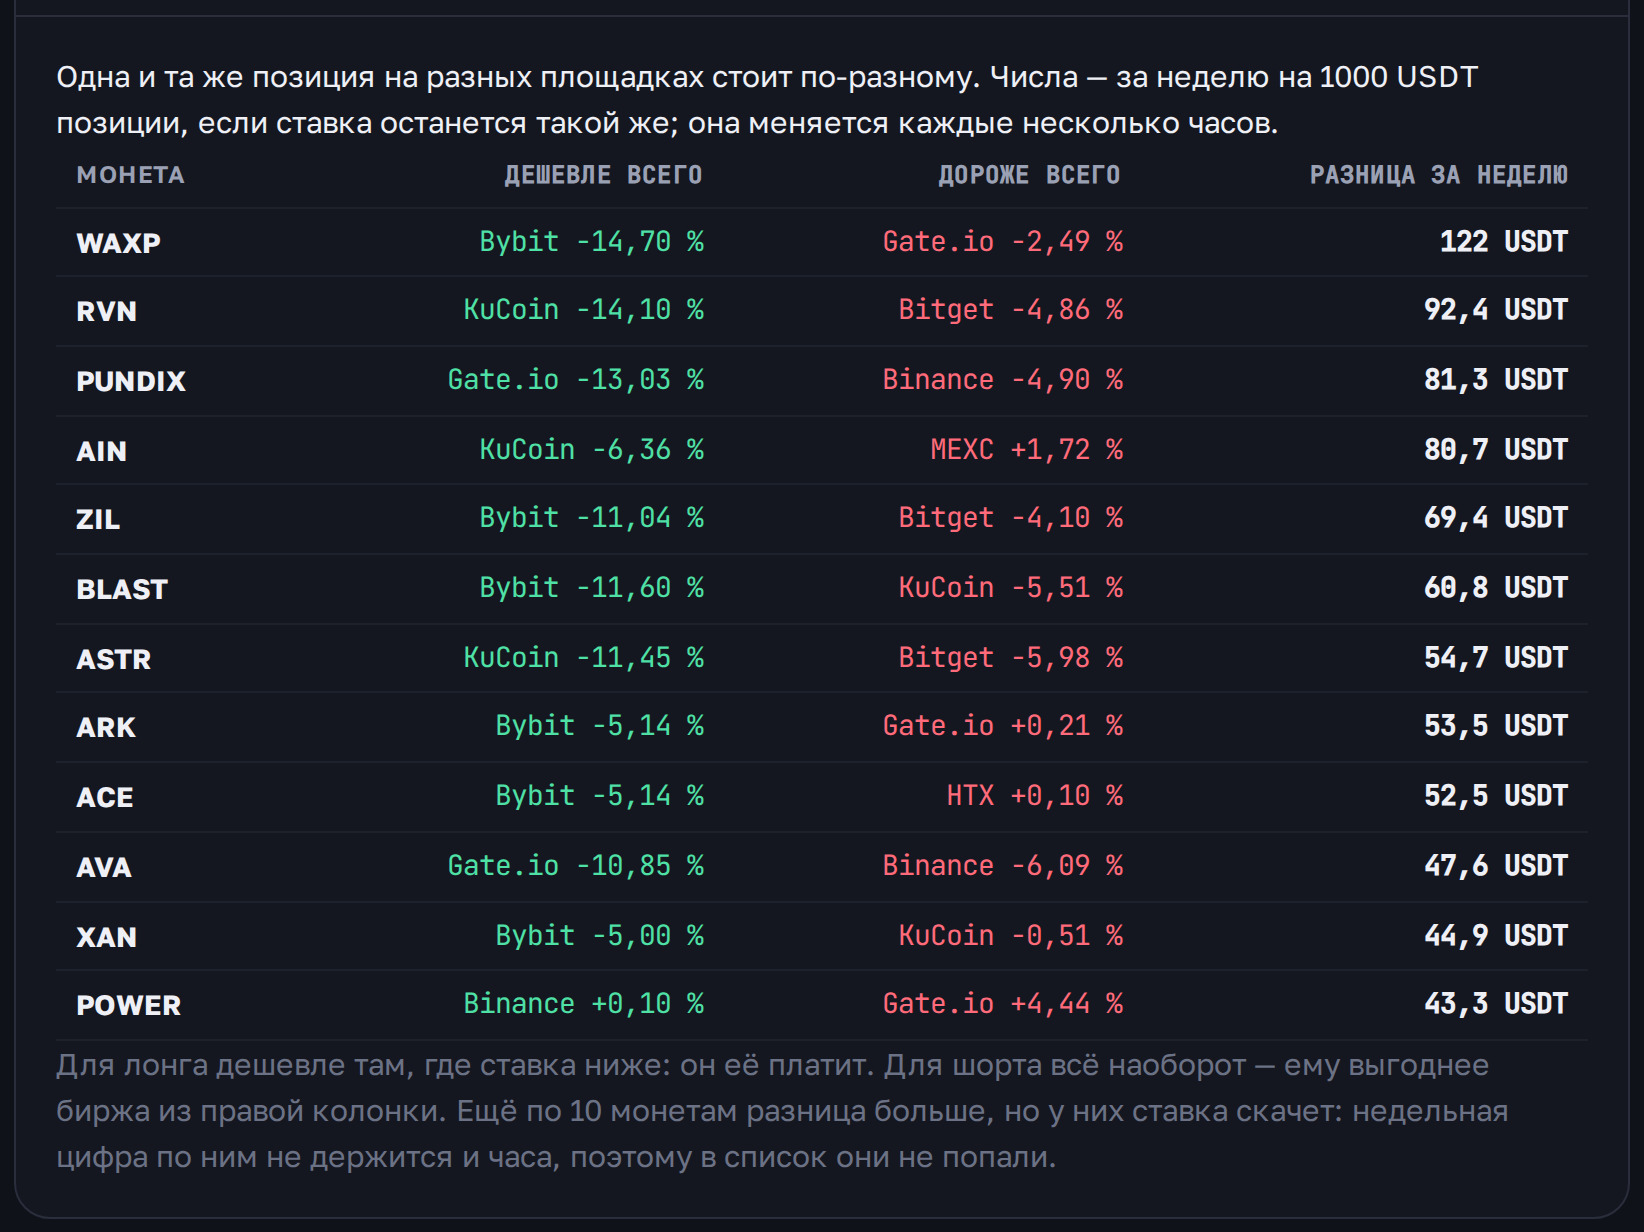
The cost of time differs by venue, and on a single coin the gap reaches tenths of a percent a week. On a thousand dollars that is a few dollars, on ten thousand it is tens — and people pay it simply because they never looked.

  • Every exchange's rate for the coin side by side, priced per week
  • The difference straight away in dollars on a 1000 USDT position
  • Lower is cheaper for a long and the opposite for a short — and it says so
  • Coins with a jumpy rate are kept out of the list
See the comparison →
The same position costs less on another exchange
12 — Tide

You see when a coin is suddenly being talked about

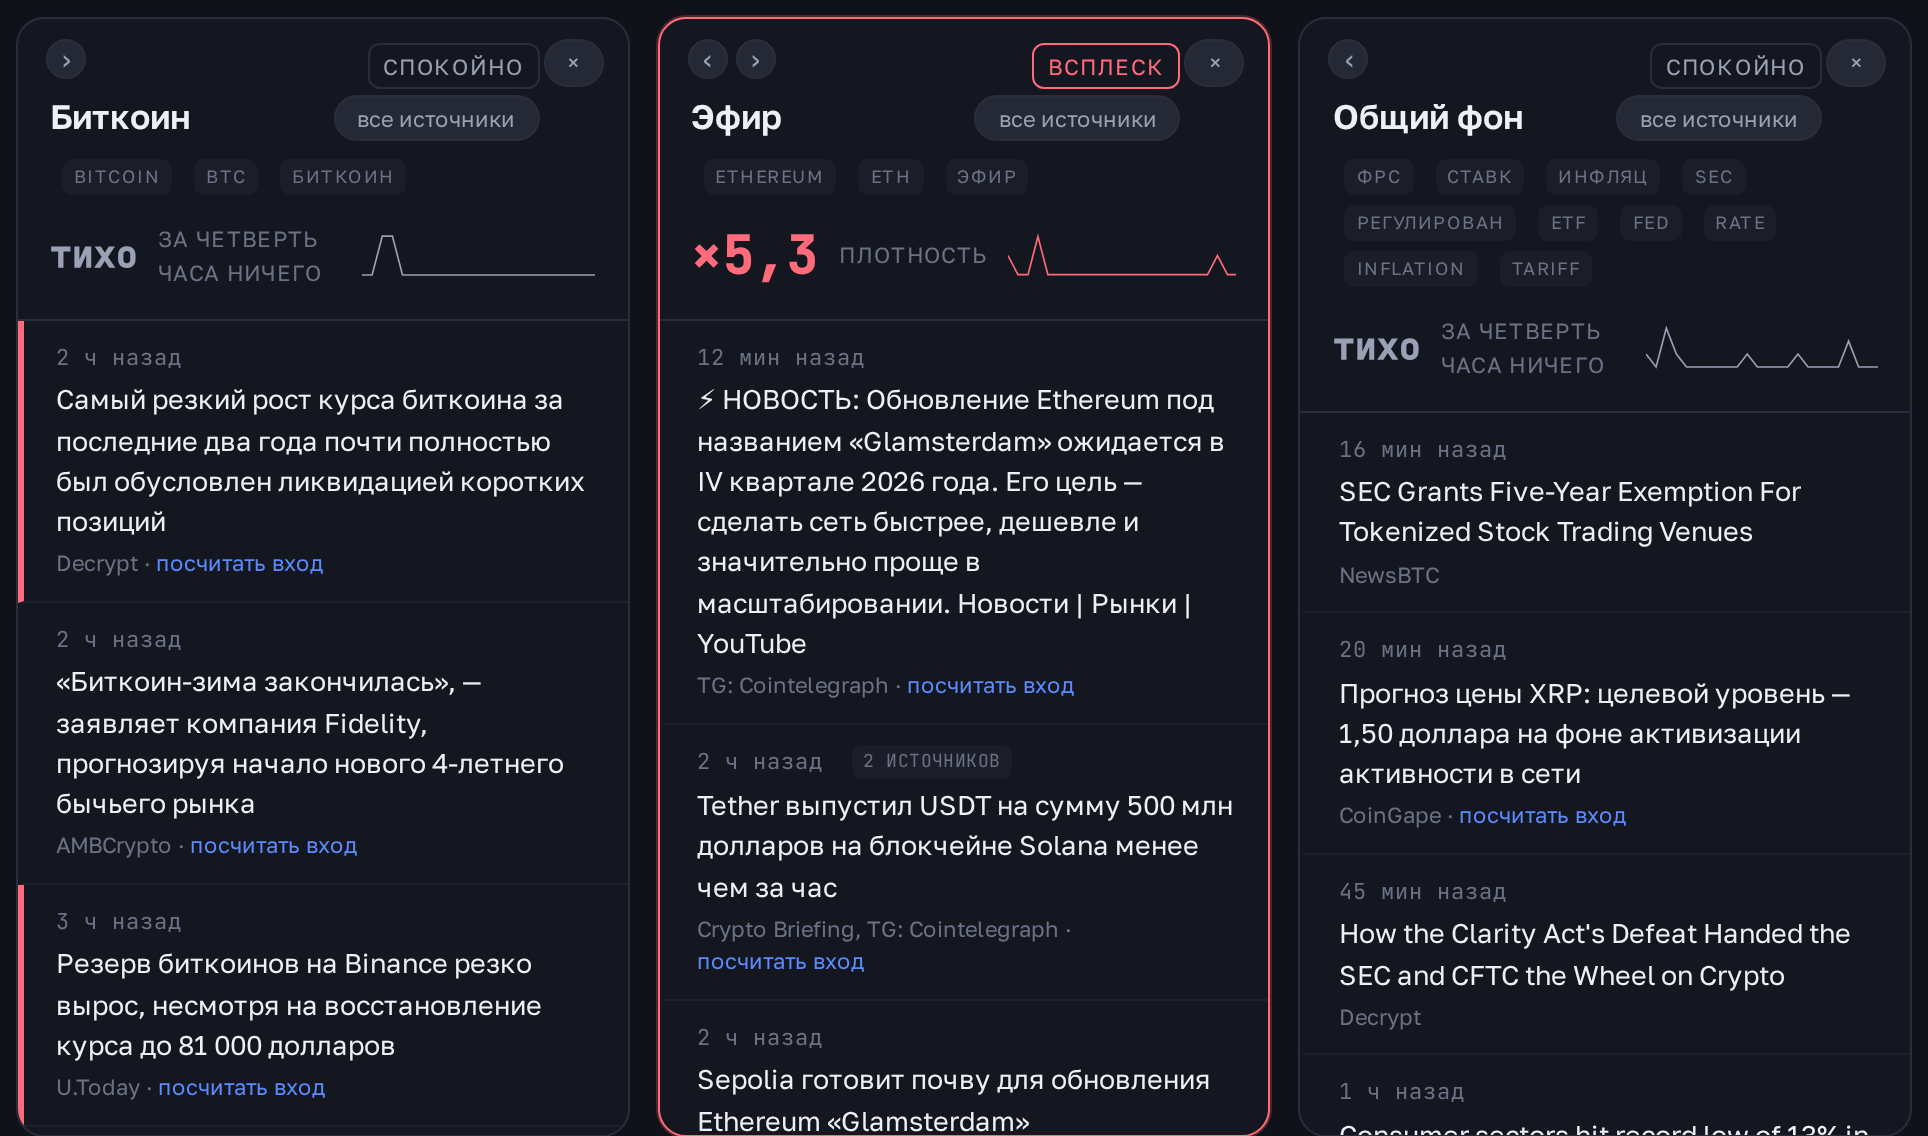
A single news item means nothing — there are always plenty. What means something is when a coin is written about several times more than usual. A spike of attention arrives before the move reaches the chart. The service measures the multiplier against the usual level and shows where it has just caught fire.

  • Seventeen Telegram channels and exchange announcements — faster than publications
  • Thirty sources on one event give one card and a counter
  • Your own column from any words, with your own sources in it
  • A spike on your coin arrives as a Telegram message
See the tide →
You see when a coin is suddenly being talked about
13 — News

Only the news that moves price

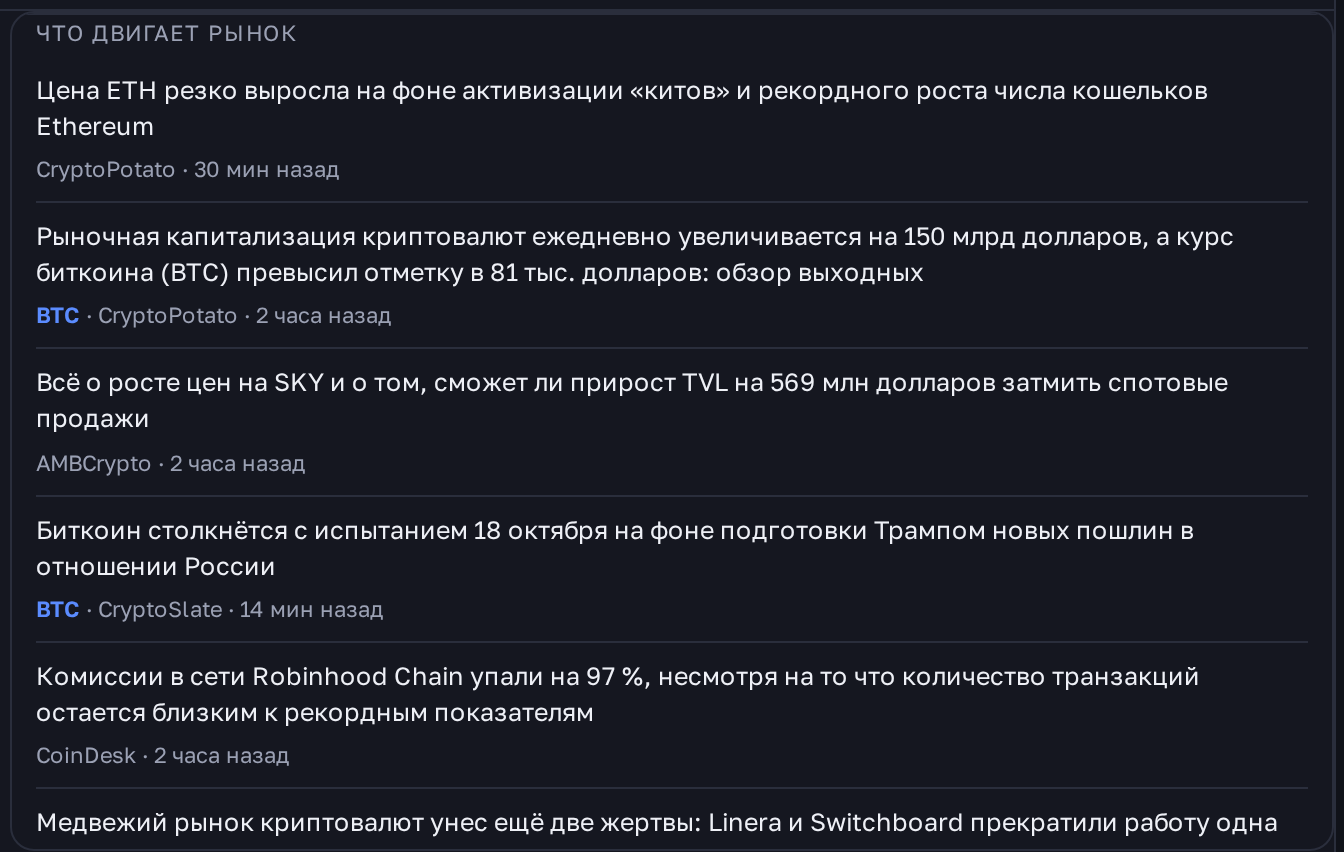
The feed is selected by impact on the market, not by freshness. A rate decision, an exchange hack, a fund launch — that is price. A “partnership with a blockchain startup” is not, and it never reaches the feed.

  • The feed sits next to your portfolio: you see why a position moved
  • A sharp move in a coin — before anyone writes about it
  • Hacks and withdrawal halts marked separately
  • An evening summary: where the market went and what was written
See the feed →
Only the news that moves price
14 — Alerts

The weekly summary comes to you

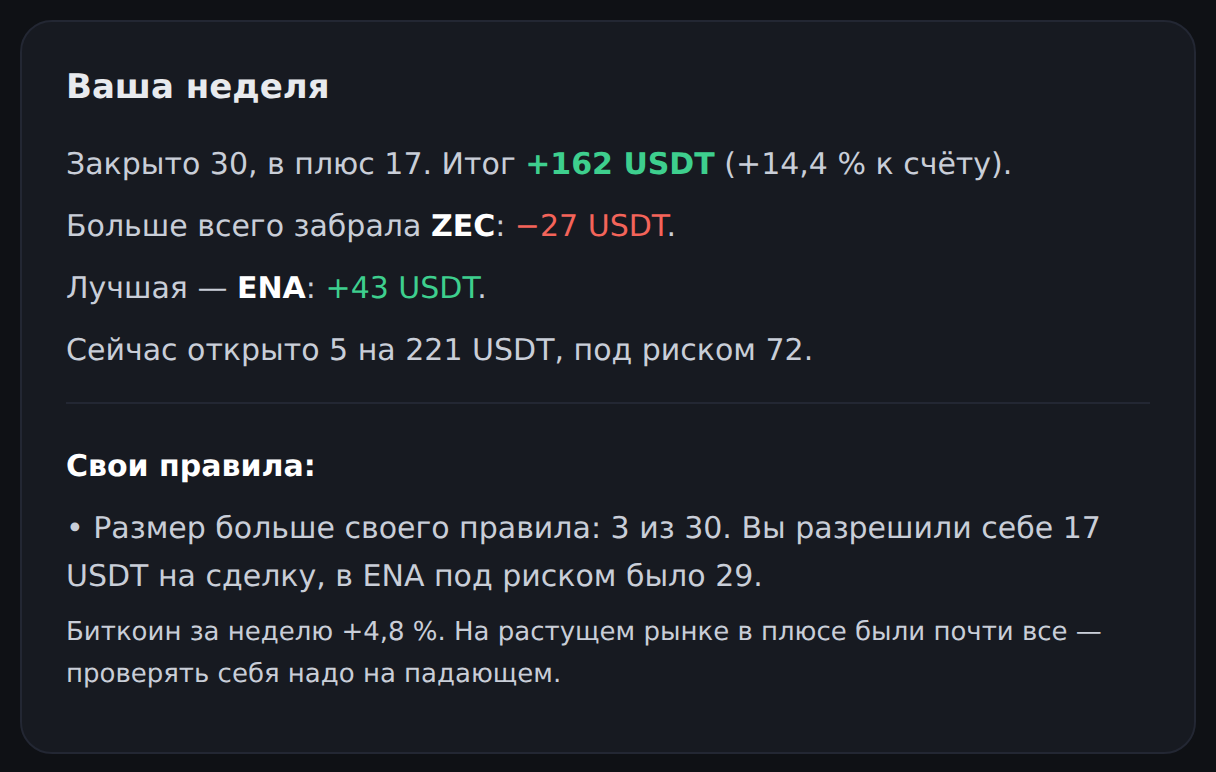
So you do not have to sit in the terminal. On Sunday evening the bot sends the week's breakdown; during the week, only what needs action.

  • What the week came to and where you lost most
  • Which of your rules you broke and how that ended
  • Stop or target hit, holding time over
  • The market turned against your open trade
Connect the bot →
The weekly summary comes to you
How we count

Costs are subtracted, not printed in small type

A scheme promises six percent — but the exchange charges its fee twice, the book fills you slightly worse than your order, and funding is taken for every eight hours you hold. We count what is left for you and show the whole subtraction.

Position size works the same way: it follows from your risk rule, so the stop costs exactly what you allowed yourself to lose.

Move to target+6,0 %
Entry and exit fee−0,11 %
Slippage−0,03 %
Funding for the holding time−0,18 %
Left for you+5,68 %
The whole service, no words

What it looks like in use

A recording of the real terminal from the first screen to the last: portfolio and today's plan, pricing an entry with its verdict, the ruler on the chart, coins by risk, the news tide, longs and shorts, the cost of time and the breakdown of your own trading. Nothing is staged.

In the recording the service says no: at the chosen leverage the risk breaks the rule, and the verdict says so plainly instead of keeping quiet.

Everything the service measures

Every tool: the question it answers and what it is computed from

Below is the whole service, part by part. Not a single number here comes from someone else's signals: everything is computed from exchange candles, from your own journal and from open news sources.

Entry and risk

How the trade you have in mind would end: where liquidation hits, how much the stop takes and how many times the coin already travelled that far.

From hourly candles over 90 days. Fees on both sides, order-book slippage and funding are subtracted from the result, not added as a footnote.

The ruler on the chart

How an entry anywhere in history would have ended — you just drag across the chart.

A trade with your stop and target is replayed on the candles of the selected stretch: would it have reached the target, or would you have been stopped out first.

Today's plan

What to enter today, and with what size.

A scheme for each coin is fitted on two thirds of the history and tested on the last third the fitting never saw. Schemes that fail the test are not shown at all. Position size follows from your own risk rule, so the stop sits exactly on the amount you allowed yourself to lose.

A stop before the trade, not after

To say you are breaking your own rule before the trade is recorded, not in a monthly report.

Before recording, the service checks the trade against your rules: risk, share of one coin, total risk across open positions. These are arguments, not a ban: the «take it anyway» button works.

Journal and discipline

Why your result is what it is, not just what it is.

Trades are imported as a single export file from the exchange or entered by hand. Then comes what no exchange report shows: how much longer you hold losers than winners, and what entries above your rule have cost you.

Trading breakdown

Which hours, which coins and which days actually work for you.

Computed from your journal: slices by time and by coin, a month calendar with each day's result. A slice backed by fewer than ten trades is flagged — five cases are not a conclusion.

Market turn

When a side stopped working — earlier than your stop would tell you.

The same scheme is recomputed on the last week's entries. Ninety days describe the market's habit, one week shows whether it has changed; when the two disagree, the service says so right in the row.

Cost of time

What it costs simply to keep a position open.

Funding per coin: per charge, per day and per week. The charging interval differs by coin — one hour, four or eight — so everything is converted to a day, otherwise the rates cannot be compared.

Comparing exchanges

Where the same position is cheaper to hold.

One coin's rate across all venues side by side, with the weekly difference. Below 0.05 % a week the gap is not flagged: moving the position would eat the gain.

Longs and shorts

Where the crowd has piled in, and what that threatens.

Open interest is read together with price: both rising means new longs are coming in; price up while interest falls means shorts are being squeezed out. The cluster map is built from typical leverage.

Your setups

Whether the setup you trade actually works.

You describe your own entry and exit condition, the service replays it across coin history and shows what came out: share of targets reached, average result, and which coins the setup still works on.

Choosing a coin

Which of two coins suits you today.

Two coins are placed side by side using the same numbers: range, target reachability, cost of time, state of the crowd.

News tide

Where a coin is suddenly being talked about — before the move reaches the chart.

Messages from thirty-odd Telegram channels, media feeds and exchange announcements come together into one stream. A spike is not the number of news items but their density over half an hour, divided by the same coin's usual weekly flow. Duplicates about one event collapse into a single row.

Telegram alerts

Hear about your trade without sitting in the terminal.

The bot writes when the target is reached, the stop is hit, the holding period ends or the market turns against an open position — naming the exchange and linking to it. Once a week a report arrives: what you made, where you lost, what you broke.

Bitcoin from the blockchain

What phase the market as a whole is in.

Once a week: MVRV, realised price and Z-score. This is on-chain data, not exchange candles, and it comes from an outside source — so it updates less often than everything else.

Coin breakdowns as separate pages

See the numbers for a coin without configuring anything or signing up.

The same math as in the terminal, already computed and spelled out in words: one page for every liquid coin.
How it goes

How people use it

1 Enter your account size

Position size and the loss limit follow from it. The balance is kept by the service from your closed trades.

2 Take a trade from the plan or price your own

The plan has ready levels; manual mode takes your coin, your stop and your holding time. Either way you see where it wipes you out and what that costs.

3 Log the trade with one button

The journal is filled with the same numbers shown on screen, and the exchange opens right away. Stop and target close the trade without you.

4 Read the breakdown

Once a week the bot sends the summary: what the week came to, where you lost most and which of your rules you broke.

Also in the terminal

Small things you would miss

Coins by risk

The whole list with no filtering: daily range, crashes, liquidity, risk tag

Watchlist

Your coins in their own section, so you do not hunt for them each time

Coin breakdown pages

A ready calculation for every liquid coin — opens without signing in

Your own rules

Risk per trade, night entries, per-coin limit — the service stops you before you break them

Read-only exchange key

Trades arrive on their own; the service cannot trade or withdraw

A separate account per exchange

Balance and risk are counted on the venue where the trade is open

Install on your phone

The terminal installs as an app and opens from the home screen

Russian and English

The same calculation, two interface languages

Pricing

Payment by card through Telegram or with Stars. While testing continues, the terminal is fully open without a subscription.

TradingRisk for a month

1 499 ₽ 1 499 ₽ per month

Try all of it without committing half a year ahead

Subscribe

TradingRisk for 3 months

3 990 ₽ 1 330 ₽ per month
11 % cheaper than monthly

Today's plan, a journal with breakdowns, alerts, your own coins

Subscribe

TradingRisk for six months

7 190 ₽ 1 198 ₽ per month
20 % cheaper than monthly

The same for six months — a month works out a fifth cheaper

Subscribe
best value

TradingRisk for a year

11 990 ₽ 999 ₽ per month
33 % cheaper than monthly

The best value: a month costs a third less

Subscribe
Tide: the news flow

A spike of attention on a coin before the move reaches the chart: your own columns from any words, seventeen Telegram channels and exchange announcements, duplicates collapsed, and an alert when it catches fire on your coin.

999 ₽ per month, on top of the subscription Add it
What is included

All of it works on any subscription length

Entry and risk calculation
  • Liquidation price at your leverage, costs included
  • How many times in 90 days price travelled that far
  • Stop and target in money, not percent
  • Position size from your risk rule
  • Fees, slippage and funding subtracted from every number
  • A verdict in words, including “do not enter”
  • Three schemes: cautious, normal, aggressive
  • Your own stop, target and holding time on sliders
Today's plan
  • Schemes that passed the test on a held-out third of history
  • Ready levels: entry, stop, target, holding time
  • A fresh measurement of the same scheme over the last week
  • A mark if you already hold a position in that coin
  • How many trades are open in each coin
  • How coins move together: how many independent bets you really have
  • One button: log the trade and open the exchange
  • What was dropped from the plan and why
Journal and discipline
  • Import from an exchange file, with duplicate protection
  • Read-only exchange key: trades arrive on their own
  • The balance is counted from your closed trades
  • A separate deposit per exchange
  • Automatic close on stop and target without you
  • A “why I entered” note and a breakdown of which reasons work
  • Journal export to a file for any spreadsheet
  • Stopped before you break a rule, not counted afterwards
Trading breakdown
  • Your own rules instead of built-in ones: risk, night, number of positions
  • How often you entered above your own rule
  • How many times longer you hold losses than profits
  • The month calendar: what each day brought
  • Slices: which hours and which coins work for you
  • Your setups: describe them with conditions and the service finds the trades and measures them
  • Trade replay on the chart — what was visible at entry
  • The equity curve and a month-by-month breakdown
  • Where risk piled up and how much of it is in the market now
Cost of time
  • Funding for each coin: per charge, per day, per week
  • What a week of holding costs on a 1000 USDT position
  • Where you pay and where you get paid
  • Each coin has its own charging interval — shown next to the rate
  • The skew streak: how many days in a row one side pays
  • Exchange comparison: where the same position is cheaper to hold
Market, longs and shorts
  • What the market is doing now: regime, breadth, fear and greed
  • A news feed selected by impact on price
  • Money in open positions and how it moved over a day
  • The share of accounts that are long and where the skew is strongest
  • The conclusion in words: new money, short squeeze, shorts building
  • An estimate of clusters: where price would go and how much it wipes out
  • A comparison of two coins by the same numbers
  • A warning when a side stops working
Telegram alerts
  • Stop or target hit — the trade is closed automatically
  • The holding time is over
  • The market turned against an open trade
  • The daily summary and a broad market turn
  • The weekly summary: what came out, where you lost, what you broke
Data and access
  • Ten exchanges to choose from, decentralised ones included
  • 90 days of hourly candles in every measurement
  • Your own coins beyond the automatic list
  • Coin breakdowns as separate pages
  • Install on your phone
  • Russian and English

Measuring risk takes a minute before the trade

No sign-up needed to look around. Open any coin and price your entry.

Open the terminal